
Management Overview
Management Overview Dashboard
One executive cockpit with revenue, margin, EBITDA, OTIF and inventory KPIs versus budget and target.
One overview for the whole leadership team
We connect your systems, centralise your data and build KPI dashboards so you can steer daily on what is really happening.



SCM Executive Overview
Supply chain costs and margins per channel and location.
Dashboards built for organisations like




Pain points
ERP, CRM, Excel and other systems each hold part of the truth. We bring this data together in one central model.
Revenue, costs, utilisation or operational deviations are often only found after they have had impact. A dashboard makes these developments visible right away.
Exporting, combining and checking Excel files by hand costs time again every month. We automate this process.
One source of truth
Collect data from ERP, CRM, Finance, HR, Operations, Excel and external systems in one central environment. Ready for reliable reporting, analytics and AI.
Showcase
From finance and sales to operations, HR and supply chain. See examples of dashboards we develop for different questions.
One executive cockpit with revenue, margin, EBITDA, OTIF and inventory KPIs versus budget and target.
One overview for the whole leadership team
Revenue, margin, cash flow and budget in one consolidated view.
Instant insight into revenue and margin
Actuals vs budget, OPEX breakdown, margin development and outstanding receivables and payables.
Instant insight into revenue and margin
From scattered data sources to one reliable view of the chain.
Dashboards running in production at organizations such as
Cases
Examples from client projects. The figures shown come from those specific projects and are not a general promise.
In a short intro call we look at which data sources are available, which KPIs matter and how we can bring them together in one overview.
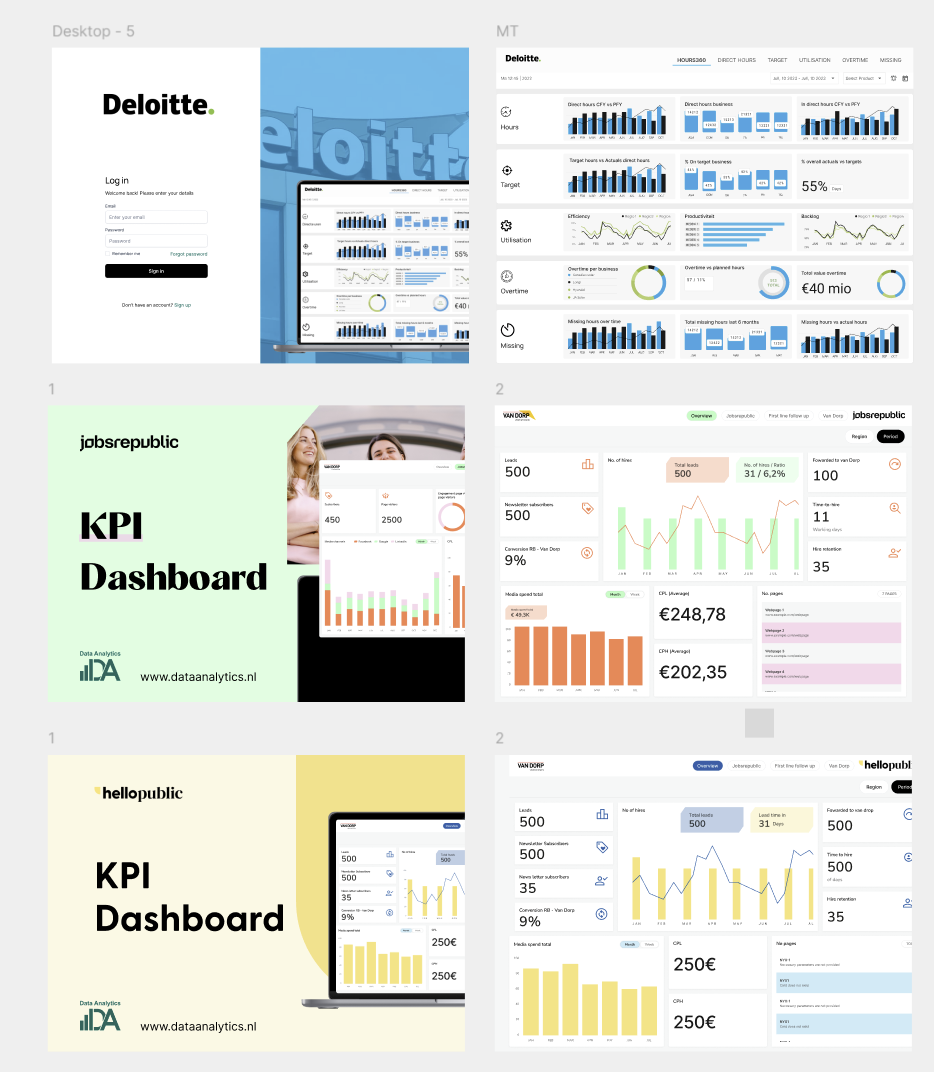
Mockups
Mockups are a fixed part of every project we do. They show up front what your dashboard will look like and how it will work.
A picture says more than a thousand words
Before a single line of code is written, you already see the dashboard. That way we discuss real choices instead of abstract requirements.
We iterate until the final mockup
In a few short rounds we sharpen layout, KPIs and visuals with your team, until everyone agrees on the end result.
Everyone knows what to expect
The approved mockup is the agreement: no surprises afterwards, a tight planning and a delivery that matches expectations.
Business outcomes
Realtime dashboards that are not only good-looking, but also deliver measurable results in your organization.
−62%
reporting time
Example from a client project
From weekly reporting to realtime steering.
100%
data ownership
Example from a client project
One source of truth for the entire leadership team.
+40u
hours freed per month
Example from a client project
Automate reporting and data preparation.
+6.4%
margin uplift
Example from a client project
Steer on margin, mix and capacity with more precision.
Dashboard demo
Tell us which systems you use. In a 30-minute session we show what your numbers look like in a live dashboard.
Discover how realtime dashboards help your organization steer faster and better.
No sales pitch: a short 15-minute call with one of our specialists. Call us or leave your number.
or call us with Maurice?